(August 2019)
Sugars are carbohydrates that occur naturally in many foods but are also added as ingredients to foods. Like most carbohydrates they are used by the body for energy.
Sugars can be derived from different sources. In Australia and New Zealand sugar for commercial use is mostly extracted from sugarcane.
Simple sugars are called monosaccharides and include glucose (also known as dextrose), fructose, and galactose.
The sugar most commonly used as table sugar is sucrose. This sugar is a disaccharide which is broken down in the body to fructose and glucose, so it can be used for energy.
Is there a nutritional difference between the different types of sugars (e.g. white sugar, brown sugar, raw sugar)?
There is very little difference between types of sugar you find in the supermarket (e.g. white, brown, raw etc). They are different because of different processing techniques.
Sugar and diet
Experts generally agree that eating excess kilojoules (energy) contributes to weight gain. Being overweight or obese increases the risk of chronic health problems like high blood pressure, type 2 diabetes and heart disease.
Sugar provides the same amount of energy or kilojoules (kJ) per gram as other forms of digestible carbohydrates such as starch found in breads, rice and pasta. However some foods have a lot of sugar. It's important to remember that eating too much of any food can contribute to weight gain.
The World Health Organization (WHO) recommends that 'free' sugars make up no more than 10% of daily kilojoule intake to prevent unhealthy weight gain and dental caries. Free sugars are monosaccharides (such as glucose, fructose) and disaccharides (such as sucrose or table sugar) added to foods and drinks, and sugars naturally present in honey, syrups, fruit juices and fruit juice concentrates. For an adult of a healthy body mass index (BMI), this amount works out to about 12 teaspoons (or 50 grams) of 'free' sugar per day.
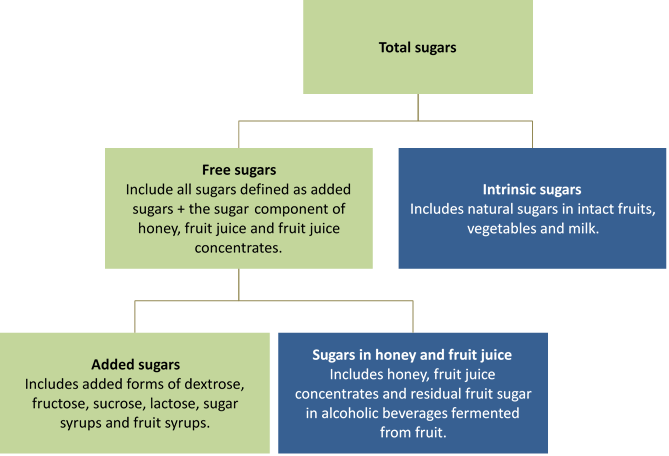
For more information on the categorisation of sugars used in the diagram above, please refer to the Australian Bureau of Satistics website.
The Australian and New Zealand Dietary Guidelines recommend limiting intake of foods and drinks containing added sugars such as confectionery, sugar-sweetened soft drinks and cordials, fruit drinks, vitamin waters, energy and sports drinks.
You can check how much total sugar is in packaged food by looking at the nutrition information panel (NIP). Because sugars are a type of carbohydrate they are included in the total carbohydrates in the NIP as well as being listed separately. The amount of sugars in the nutrition information panel will include naturally occurring sugars, such as those found in fruit and milk, as well as sugars added as ingredients to the food. Products with 'no added sugar' nutrition content claims may still contain high levels of naturally occurring sugars.
Eatforhealth.gov.au and the New Zealand Ministry for Health have resources to help people calculate their energy needs and guides to healthy eating.
Consumption
The latest statistics on sugar consumption in Australia show that:
- Between 1995 and 2011-12, Australians had a relative decrease in their consumption of free sugars, with the average proportion of dietary energy from free sugars declining from 12.5% to 10.9%.
- While the average proportions of dietary energy from free sugars in each period were each higher than WHO's recommended limit of 10%, the proportion of people exceeding that limit on any given day fell from more than half (54%) of the population in 1995 to less than half (46%) in 2011-12.
- The largest declines (and contributing most to the overall declines) in free sugars were among children. Between 1995 and 2011-12, the average proportion of energy derived from free sugars by children aged 2-18 years decreased from 17% to 13%.
- Most of the decline of children's free sugar consumption can be accounted for by the reduction in consumption of soft drinks, cordial and fruit juice/drinks. On a per 10,000 kJ of energy basis, total free sugars consumed by children aged 2-18 years dropped by an average 24 grams (from 105 grams to 81 grams per day). Over the same period the average daily consumption of free sugars from soft drinks, energy/electrolyte drinks, cordials and fruit juice/drinks dropped an average 22 grams (from 55 grams to 33 grams per 10,000 kJ).
- Soft drinks, energy/electrolyte drinks, cordials and fruit juice/drinks were the most common source of free sugars for the populations in both periods. However, Australians aged 2 years and over sourced a higher proportion of free sugars from these beverages in 1995 than in 2011-12 (44% compared with 37%).
The science (terminology)
- Monosaccharides in a ring form (e.g. glucose)
- Disaccharides – two monosaccharides bonded together (e.g. sucrose)
- Monosaccharides and disaccharides are collectively known as sugars
- Starch – a large number of monosaccharides bonded together in linear or branched structures